Dashboards
- Click on the Analytics tab.
- Click on the Products API.
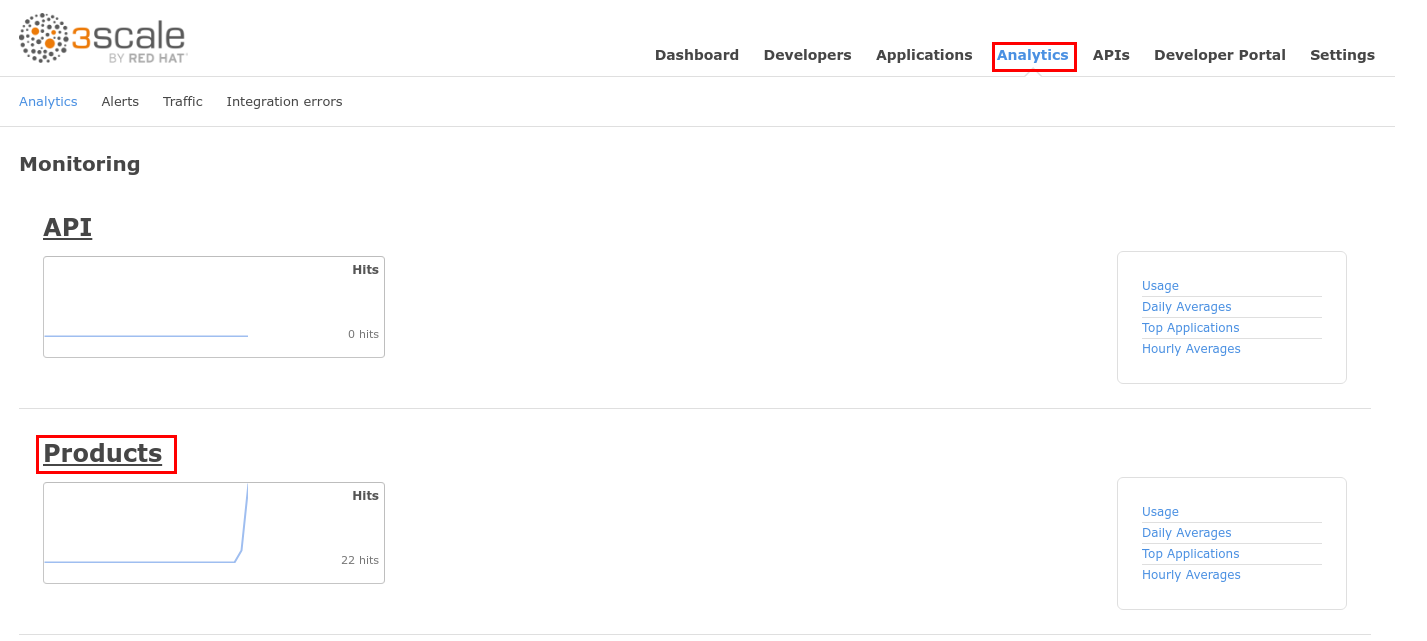
- You should see a graphic similar to this one:
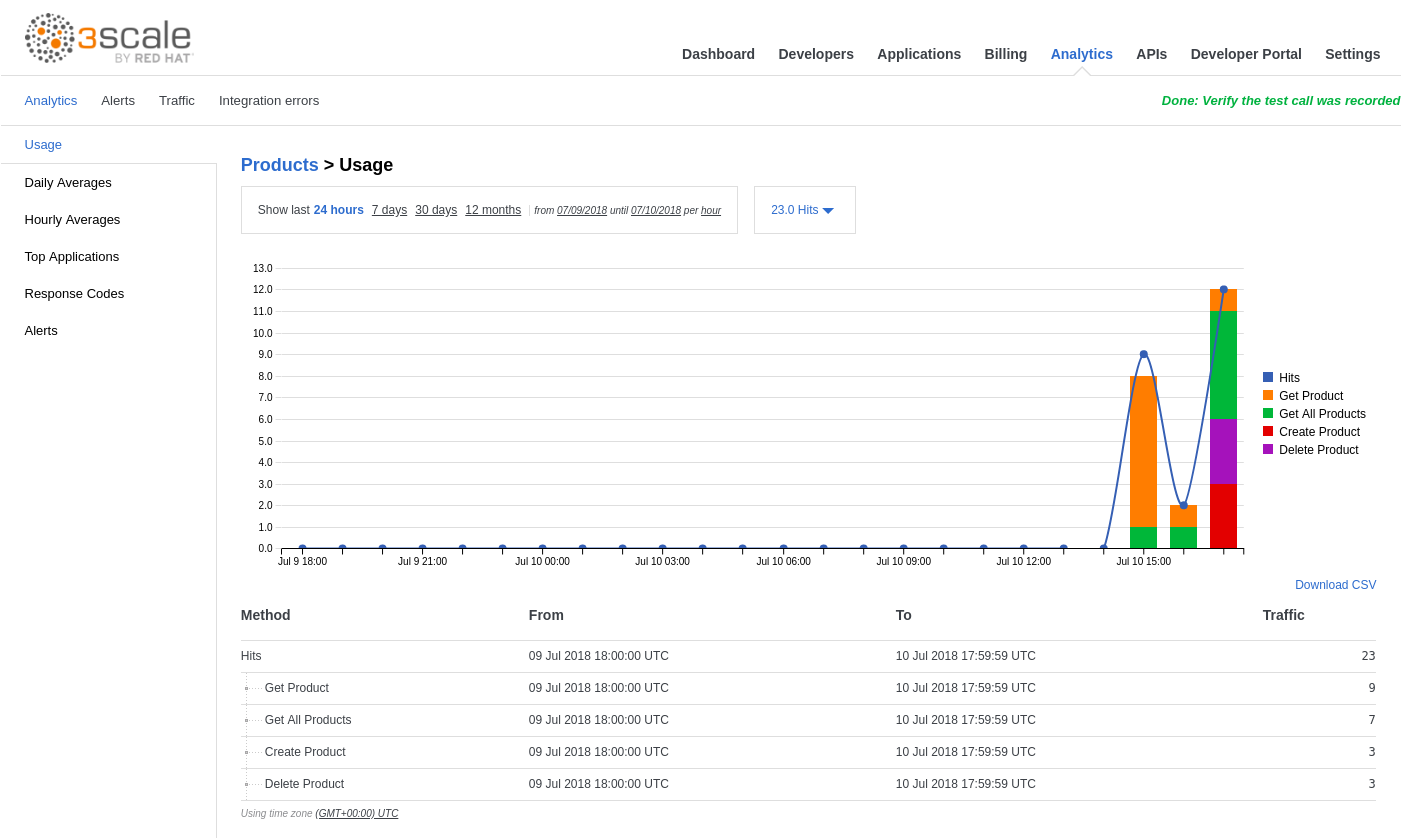
- Hover over the bars to see detailed information per period.

- Hover over the operation names to the right of the chart.
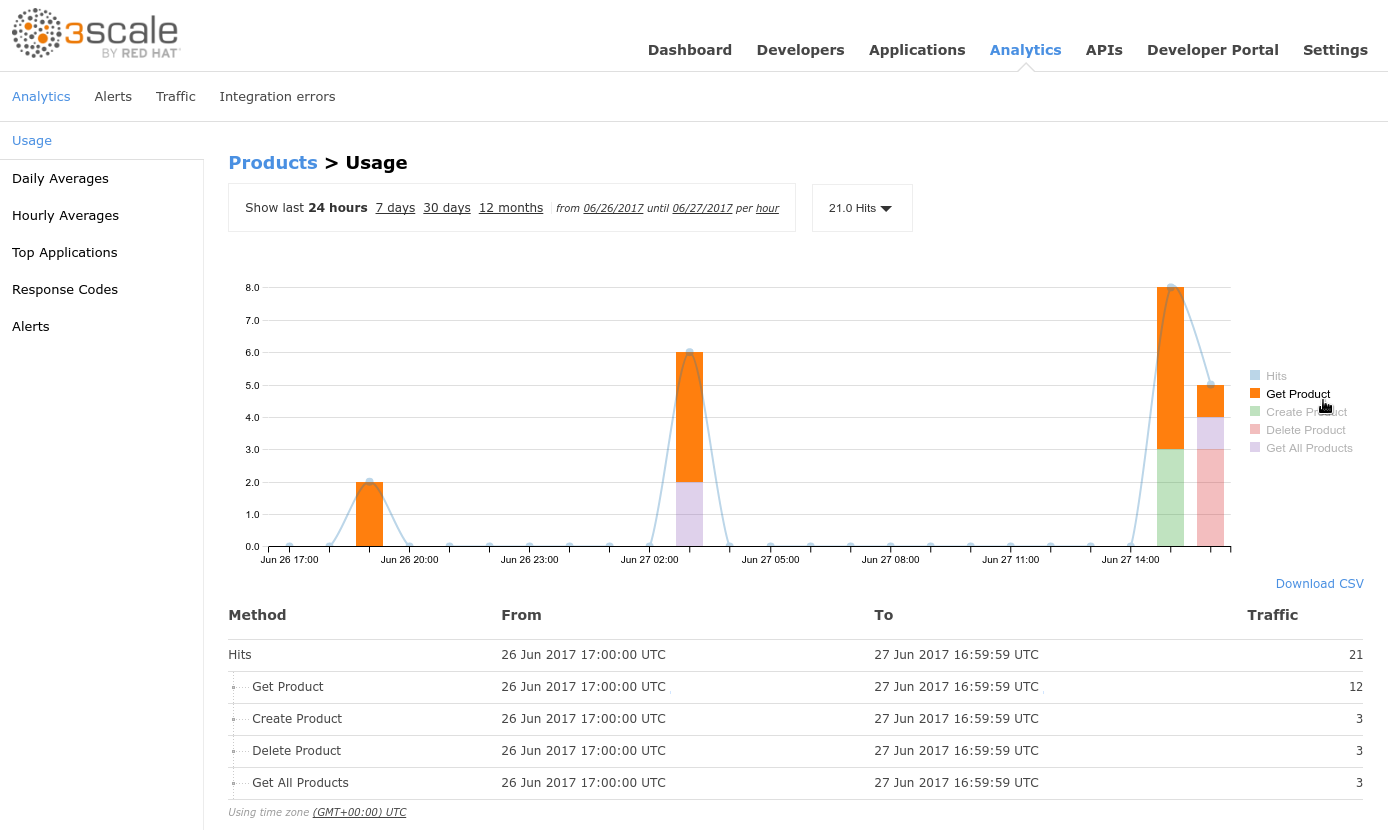
- Click on the different period options (7 days, 30 days, 12 months).
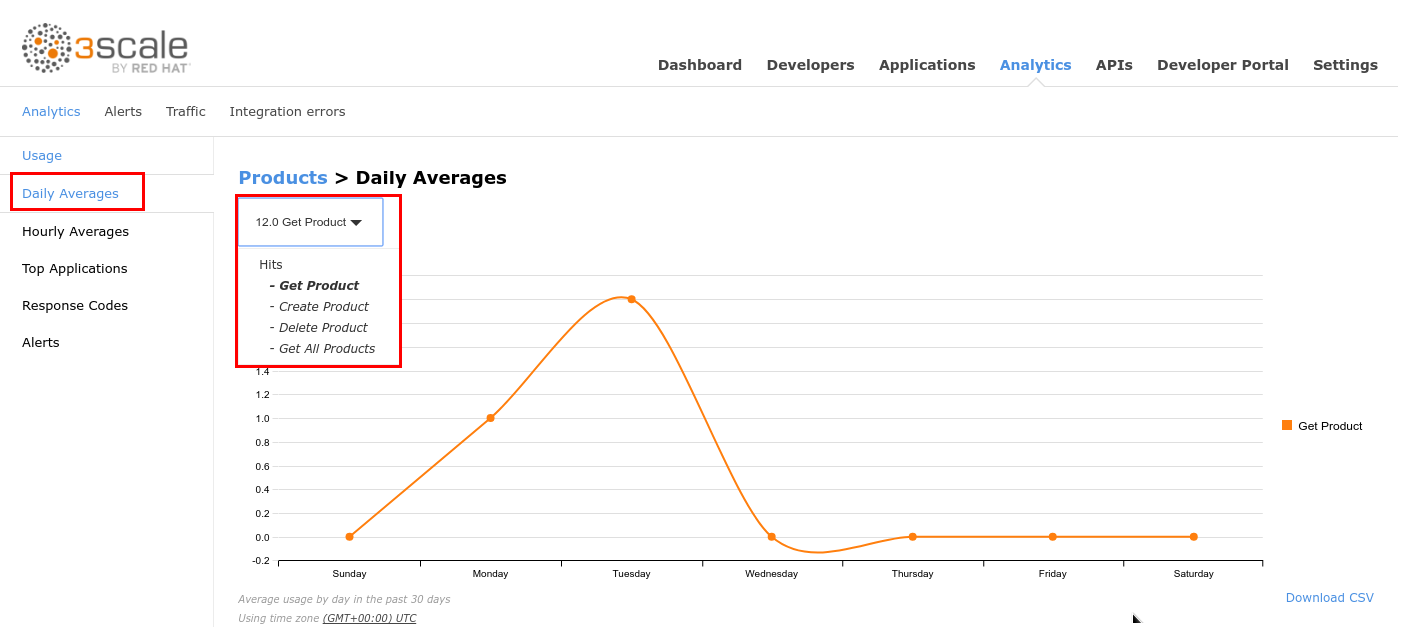
- Click on the Daily Averages tab.
- Select an operation from the dropdown.
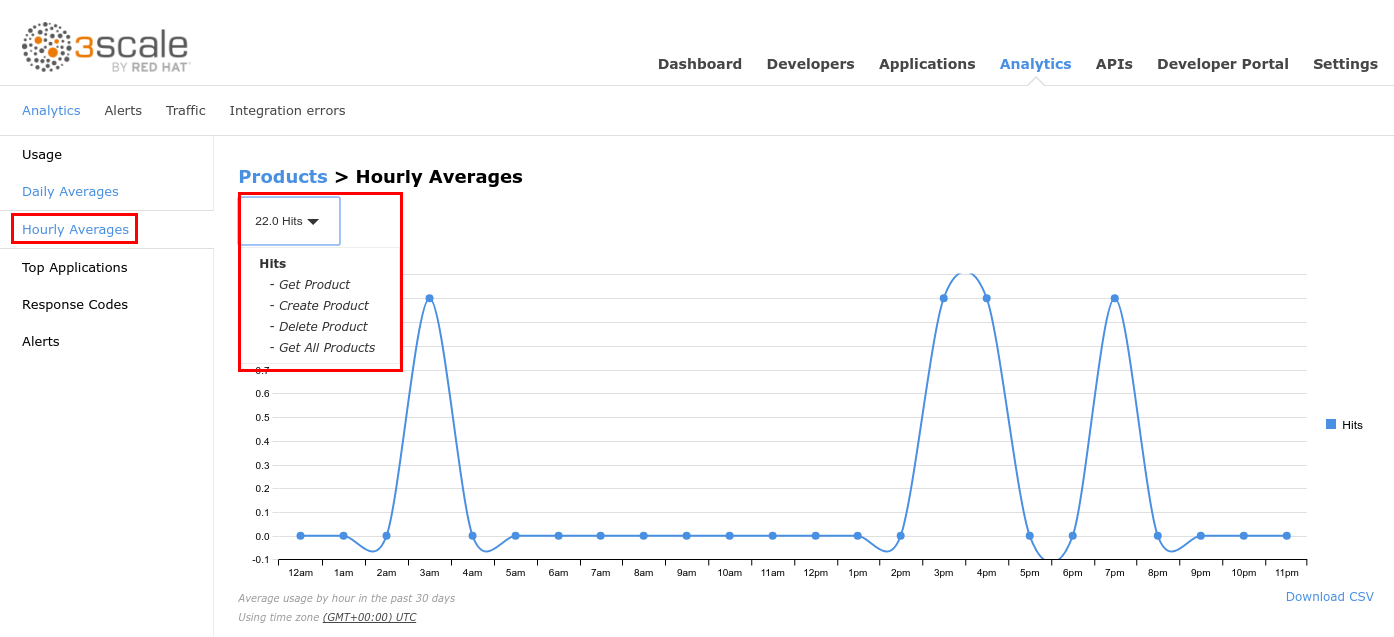
- Click on the Hourly Averages tab.
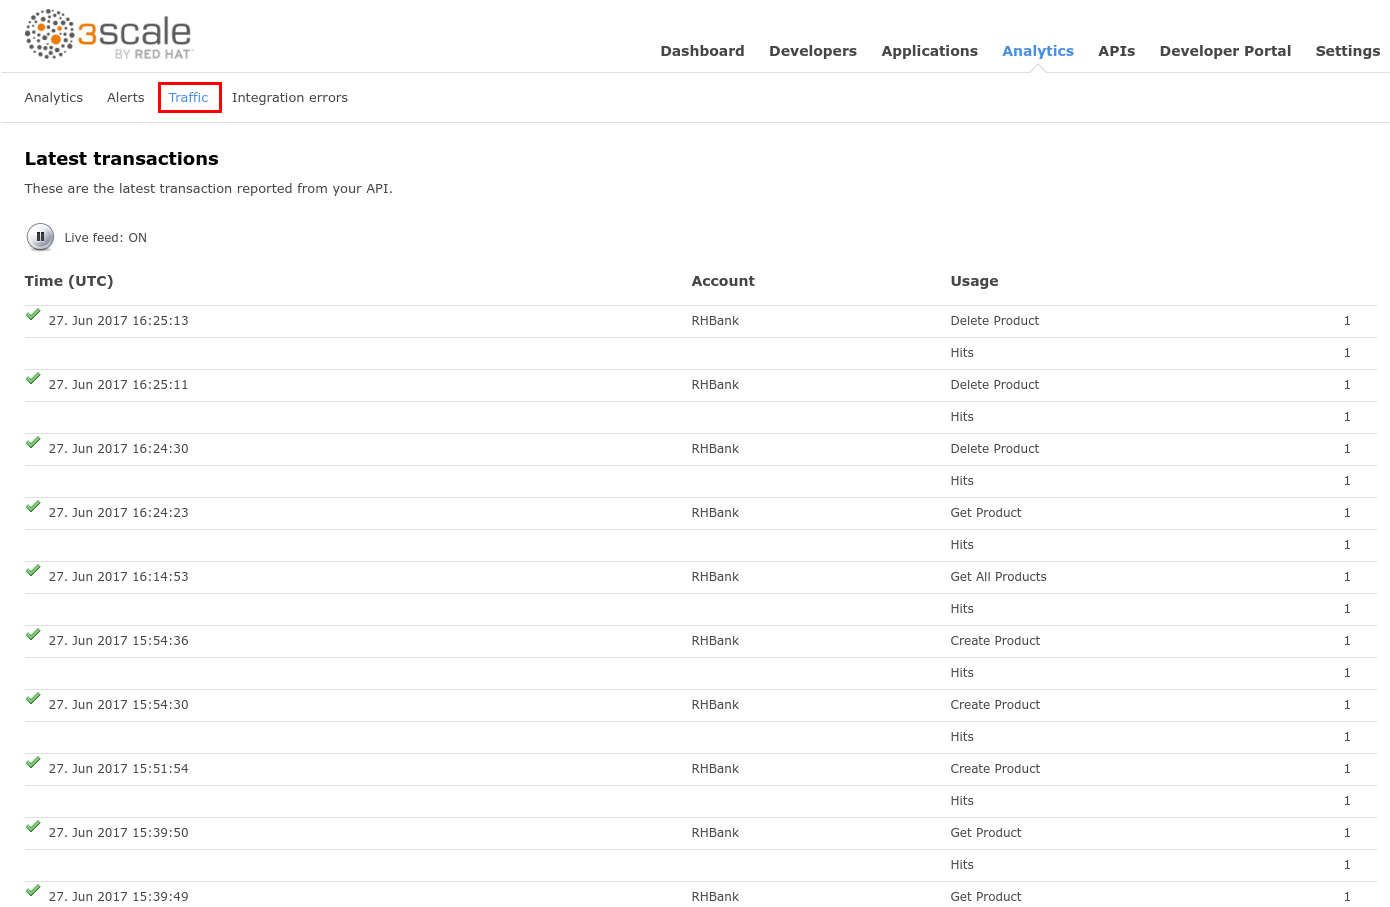
- Click on the Traffic tab.
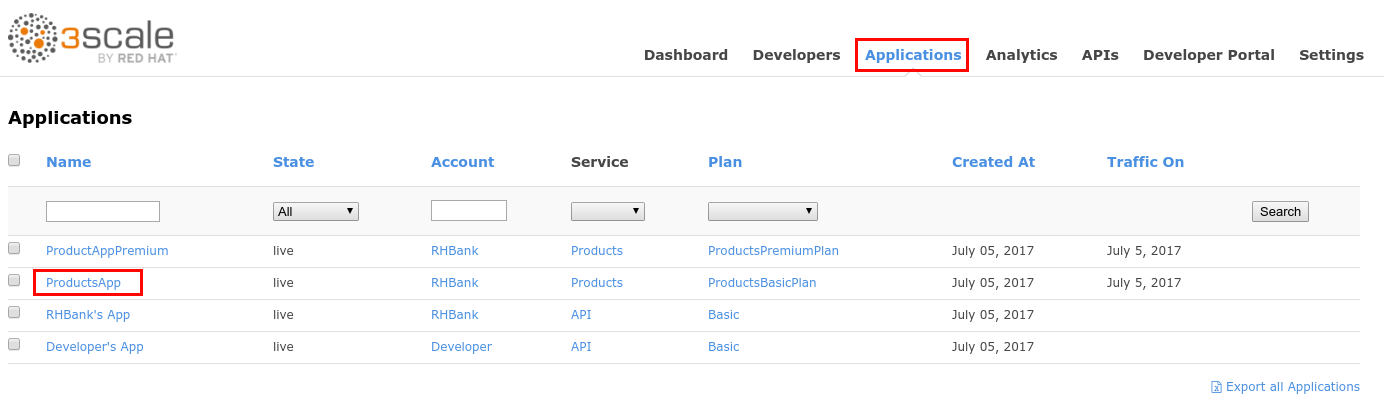
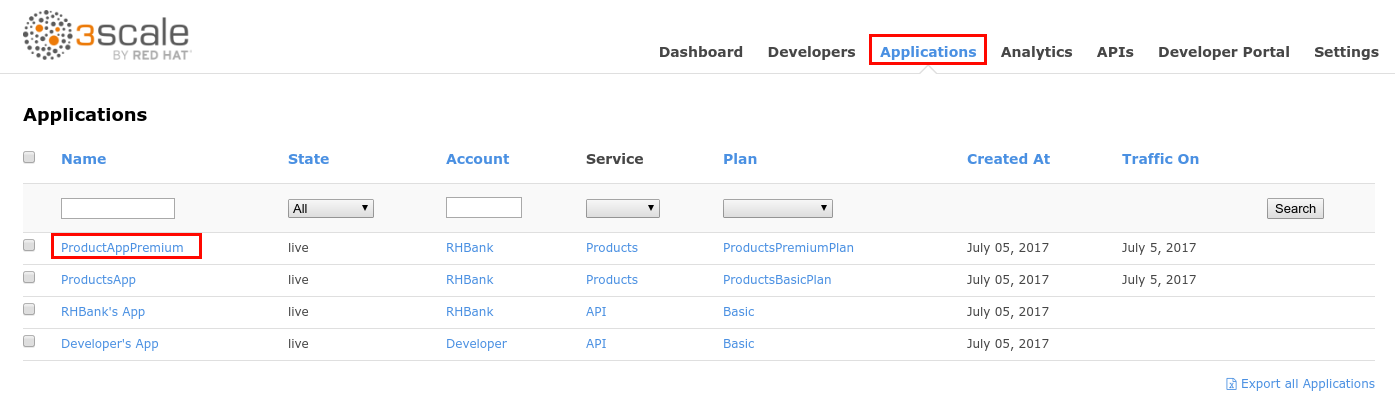
- Click on the Applications tab.
- Click on the ProductsApp application.
- Scroll down to the Current Utilization section.
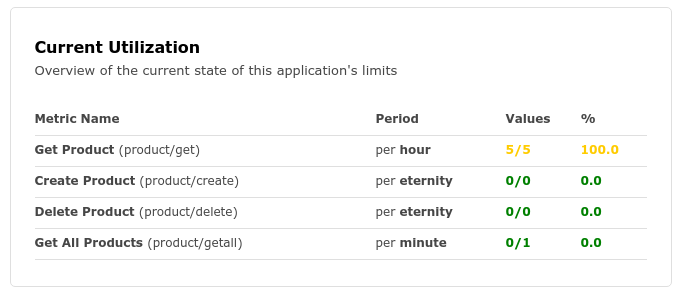
Here you can monitor an application’s limits.
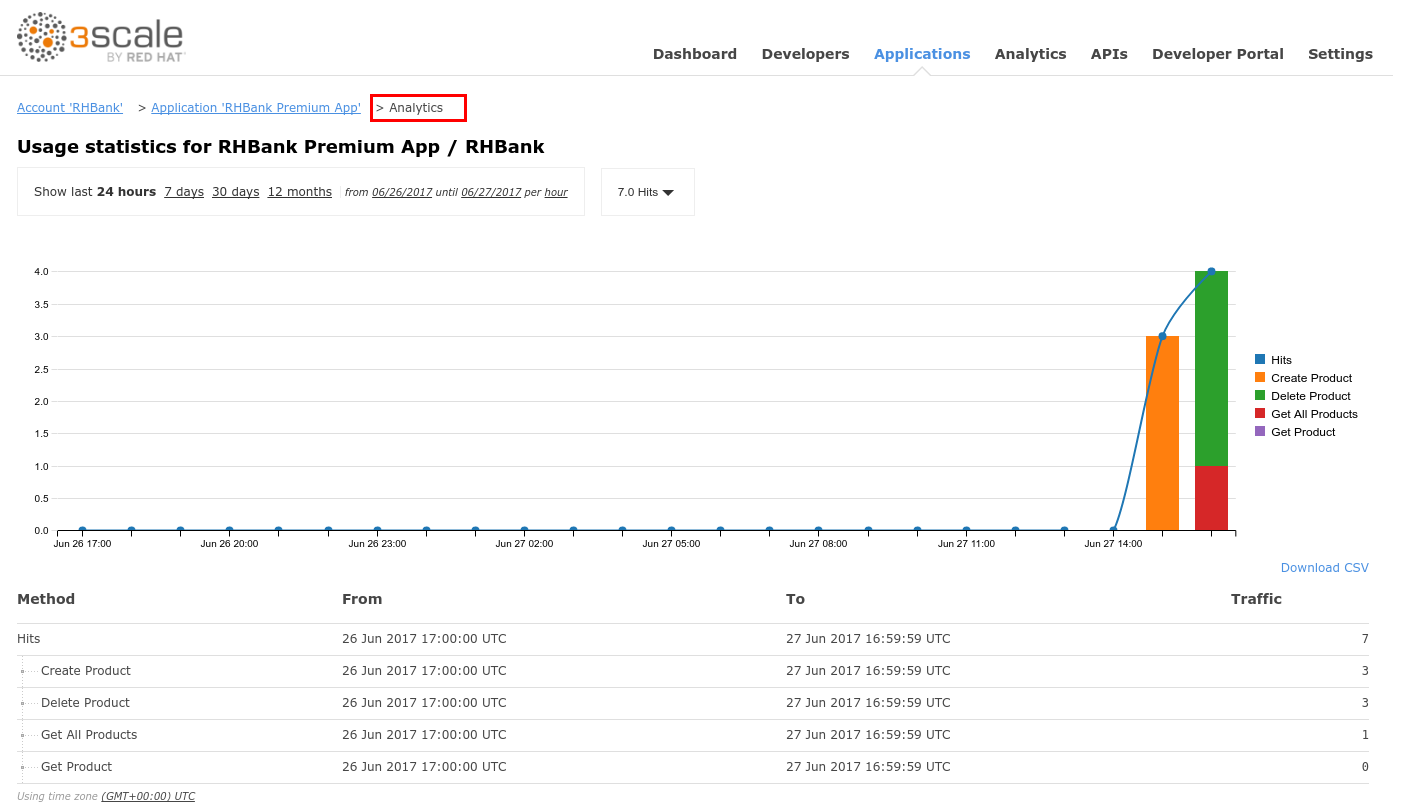
- Click on the Applications tab.
- Click on the ProductsAppApremium application.
- Click on the Analytics breadcrumb.
- Here you can monitor a specific application’s usage: