Lab 9 - Fabric
 |
In this lab you will create a Fuse Fabric, and configure Insight to view distributed logs from a central view. |
|---|---|
 |
Fuse Fabric is a lightweight runtime environment that focuses on centralizing provisioning and configuration spanning from small environments, limited to a few JVMs or systems, to larger production environments which utilize an open hybrid cloud consisting of containers on both cloud services and physical hosts. The Fuse Fabric technology layer supports the scalable deployment of JBoss Fuse containers across a network, and it enables a variety of advanced features, such as remote installation and provisioning of containers, phased rollout of new versions of libraries and applications, load-balancing, and failover of deployed endpoints. |
|---|---|
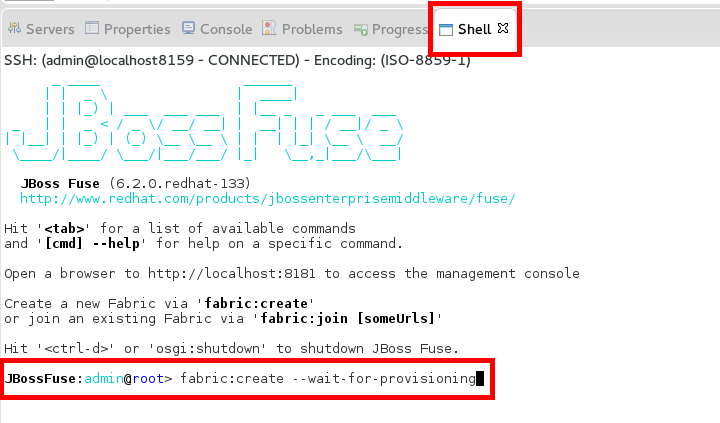
- In JBDS, make sure the Fuse v6.2 server is running.
- Click on the Shell tab.
- Create a new Fabric by executing: “fabric:create --wait-for-provisioning”
|
Fuse Fabric is a technology layer that allows a group of containers to form a cluster that shares a common set of configuration information and a common set of repositories from which to access runtime artifacts. Fabric containers are managed by a Fabric Agent that installs a set of bundles that are specified in the profiles assigned to the container. The agent requests artifacts from the Fabric Ensemble. The ensemble has a list of repositories that it can access. These repositories are managed using a Maven proxy and include a repository that is local to the ensemble. |
|---|---|
- Open a browser and go to http://localhost:8181
- Login as admin/admin
- Notice the UI has changed, because now we’ve created a Fabric ensemble, and a default root container.
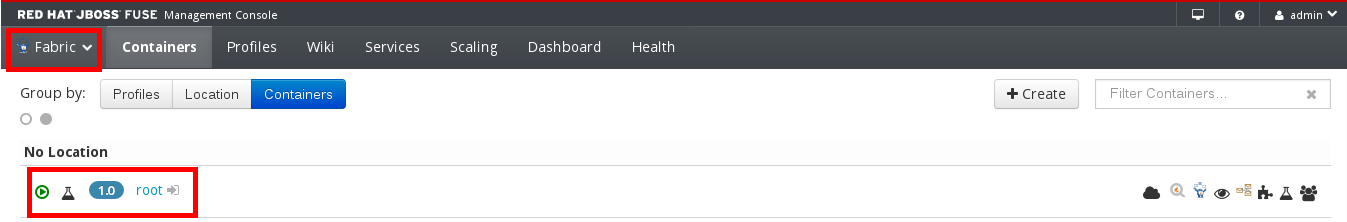
- Click on the
 icon next to the root container.
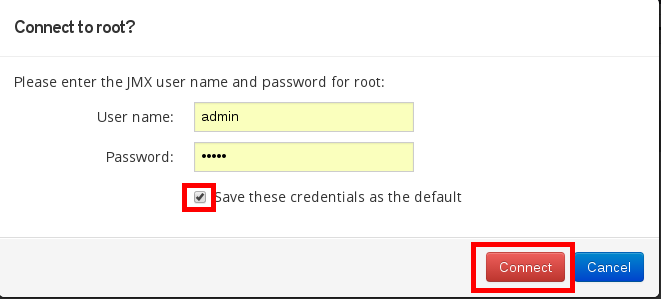
 - If a “Connect to root?” popup appears, click Connect.
- A new tab will open for the root container, look at the log, click on any log line to view its details.
- Click on the ActiveMQ tab.
- Click on the Create button.

- Enter “lab9” as the name, and “Queue” as the type.
- Click on the “Create Queue” button.
- Close the root container tab in the browser, and go back to the Fabric browser tab.
- Click on the Containers tab, and the Create button.
- Enter “els” as the Container Name.
- In the Profiles text box, enter: “insight”.
- From the list of available profiles, check “elasticsearch.datastore” and “elasticsearch.node”.

- Click on the “Create and start container” button.
- Click on the Profiles tab.
- In the “filter profiles” text box, enter “insight”.

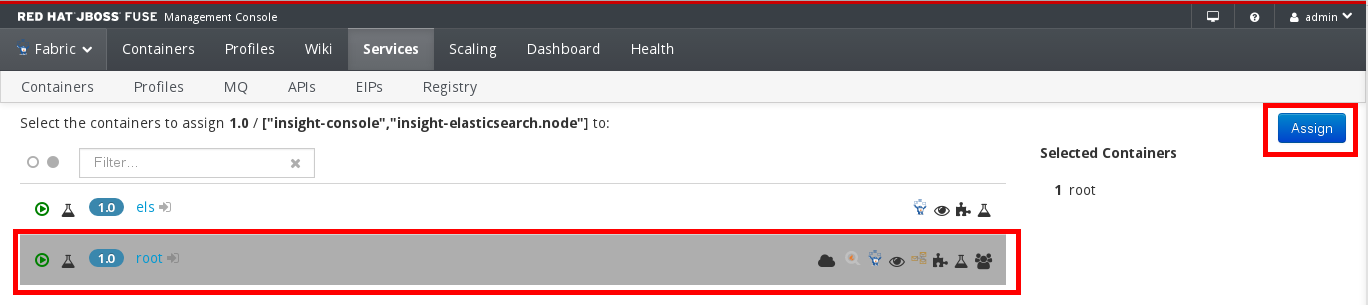
- Select “insight-console”, “insight-camel” and “insight-elasticsearch.node” profiles.
- Click on the Assign button.

- Click on the root container, and then on the Assign button.
- Back in JBDS, create a new Fuse Project (File-> New -> Fuse Project).
- Enter “Lab9” as project name.
- Select the “camel-archetype-blueprint”.
- Click Finish.

- Right-click on “com.mycompany.camel.blueprint” package under src/main/java and click Delete.
- Right-click on “com.mycompany.camel.blueprint” package under src/test/java and click Delete.
- Double-click on the blueprint.xml file under “Camel Contexts”.
- Click on Routes -> Delete Route.
- Save the file (Ctrl+S).
- Drag and drop an ActiveMQ, Log, and File component to the canvas.
- Create a link between the ActiveMQ and Log component.
- Create a link between the Log and File component.
Click on the ActiveMQ node, and click on the Properties tab.
In the Generic tab, enter “amq:lab9” as the URI.

Click on the Log node.
Enter “New message: ${body}” as Message.

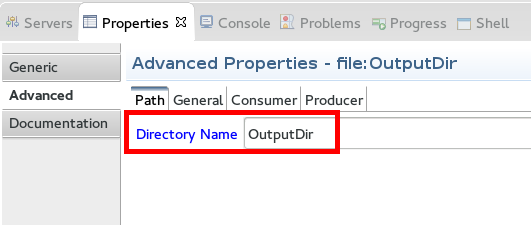
Click on the File node, Properties-> Advanced -> Path tab.
Enter “OutputDir” as Directory Name.
- Save the file (Ctrl+S).
- Click on the Source tab and delete the <bean> element.
- Save the file (Ctrl+S).
- Double-click on the pom.xml file.
- Click on the last tab (pom.xml).
- Scroll to the end of the file, and locate the </plugins> element.
- Copy and paste the following XML code before the </plugins> element:
| <plugin> <groupId>io.fabric8</groupId> <artifactId>fabric8-maven-plugin</artifactId> <version>1.0.0.redhat-379</version> <configuration> <profile>lab9profile</profile> <parentProfiles>feature-camel</parentProfiles> <features>mq-fabric-camel</features> </configuration> </plugin> |
|---|
|
The fabric8-maven-plugin comes out of the box with Fuse and it plugs in into your maven lifecycle with a few configuration lines in your project’s pom.xml. |
|---|---|
- Save the file (Ctrl+S).
- Click on Window->Preferences.
- Look for Maven->User Settings.

- Click on the “open file” link.
- Close the Preferences dialog.
- In settings.xml file, click on the Source tab.
- Locate the </settings> element.
- Copy and paste the following XML code before the </settings> element:
| <servers> |
|---|
|
This configuration allows the fabric8-maven-plugin to identify the Fuse fabric location. |
|---|---|
- Save the file (Ctrl+S) and close it.
- Right-click on the Lab9 project and click on “Run As -> Maven build …”
- Enter “fabric8:deploy” in the Goals field.
- Click Apply, and Run.
- Check the outcome of the deployment in the Console tab.
- If the build is successful, go back to the browser.
- Click on the Containers tab.
- Click on the Create button.
- Enter “lab9container” as the Container Name.
- Enter “2” as the number of containers.

- In the Profiles filter text box, enter “lab”.
- Select the lab9profile.
- In the Profiles filter text box, enter “insight”.
- Select the “camel”, “logs.elasticsearch” and “metrics.elasticsearch” profiles.

- Click on the “Create and start container” button.
|
The Insight plugin enables to centrally manage logs and metrics for multiple containers in a fabric. The Insight plugin is a set of profiles that uses Elasticsearch and Kibana technology to collect log messages and events from multiple containers in one or more data stores. You then access and analyze the messages from the Insight perspective of the Fuse Management Console. |
|---|---|
- Click on the Containers tab.
- Click on the icon, next to the root container.
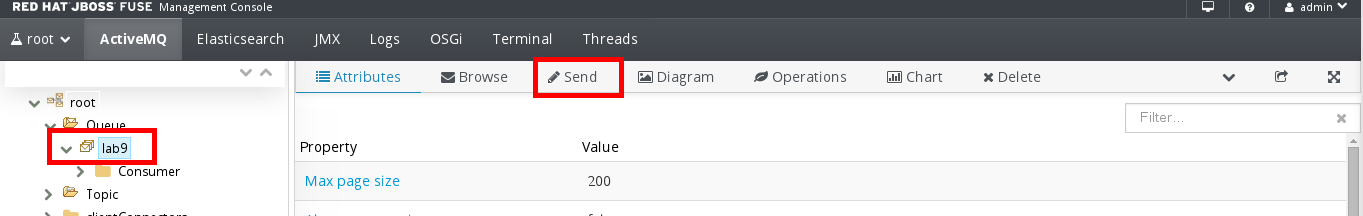
- In the root container tab, click on the ActiveMQ tab.
- Click on the lab9 queue.
- Click on the Send button.
- Select “Plain Text” as payload format and enter any text in the textbox.
- click on the Send Message button.

- Repeat these steps with a different message and send it.
- Close the root container tab.
- Back to the Fabric tab, switch to the Insight perspective.

- In the log section, you should find the two log messages produced by the two executions of the camel route in two different containers, processing the ActiveMQ messages.

- Click on the “Camel Events” tab.
- Expand the existing camel events to view their details.
